i. Total Population
1. Austria-8.474 million
2. Belgium-11.2 million
3. France-66.03 million
4. Germany-80.62 million
5. Liechtenstein- 36,925
6. Luxembourg- 543,202
7. Monaco- 37,831
8. Netherlands- 16.8 million
9. Switzerland- 8.081 million
ii. Birth rate
1. Austria-8.76 births per 1000 population
2. Belgium-9.99 births per 1000 population
3. France-12.49 births per 1000 population
4. Germany-8.42 births per 1000 population
5. Liechtenstein-10.53 births per 1000 population
6. Luxembourg-11.75 births per 1000 population
7. Monaco-6.72 births per 1000 population
8. Netherlands-10.83 births per 1000 population
9. Switzerland-10.48 births per 1000 population
iii. Death rate
1.Austria-9.4 deaths per 1 000 population.
2. Belgium-9.2 deaths/1,000 population.
3. France-9.3 deaths/1,000 population.
4. Germany-10.8 deaths/1000 population.
5. Liechtenstein-7.02 deaths/1000 population.
6. Luxembourg-8.53 deaths per 1000 population.
7. Monaco-9.01 deaths per 1000 population.
8. Netherlands-8.57 deaths per 1000 population.
9. Switzerland-8.1 deaths per 1000 population.
iv. Life expectancy (male, female, and combined)
1. Austria-80.17 years
2. Belgium-79.92 years
3. France-81.66 years
4. Germany-80.44 years
5. Liechtenstein-81.68 years
6. Luxembourg-80.01 years
7. Monaco-89.57 years
8. Netherlands-81.12 years
9. Switzerland-82.39 years
v. Infant mortality rate
1. Austria-4.16
2. Belgium-4.18
3. France-3.31
4. Germany-3.46
5. Liechtenstein-4.33
6. Luxembourg-4.28
7. Monaco-1.81
8. Netherlands-3.66
9. Switzerland-3.73
vi. Total fertility rate
1. Austria-1.43
2. Belgium-1.65
3. France-2.08
4. Germany-1.43
5. Liechtenstein-1.69
6. Luxembourg-1.77
7. Monaco-1.52
8. Netherlands-1.78
9. Switzerland-1.54
vii. Literacy rate
1. Austria-98%
2. Belgium-99%
3. France-99%
4. Germany-99%
5. Liechtenstein-100%
6. Luxembourg-100%
7. Monaco-99%
8. Netherlands-99%
9. Switzerland-99%
viii. Rate of natural increase
Austria- 0.13 per 1000 population
Belgium- 1.79 per 1000 population
France- 3.46 per 1000 population
Germany- -2.47 per 1000 population
Liechtenstein- per 1000 population
Luxembourg- 3.91 per 1000 population
Monaco- per 1000 population
Netherlands- 2.19 per 1000 population
Belgium- 1.79 per 1000 population
There are many countries with big populations but also 2 with a small population. Every single country has a very high and impressive literary rate which mean the amount of the population that is very educated. They all tend to have a low 80’s life expectancy for both males and females. You can tell that in some countries the birth rate isn’t as high as the death rate. This could be bad for the country/countries because it means that In the future the population will diminish because of less need of many children. Both women and men are very educated which means that for the most part they both have high paying jobs that they had to get a degree or diploma for.


Every country has the middle age group as their highest population in both men and women. That means that there isn’t enough babies being born to replace the current population of said country. All of the countries are in level 3 in the Demographic Transition Model
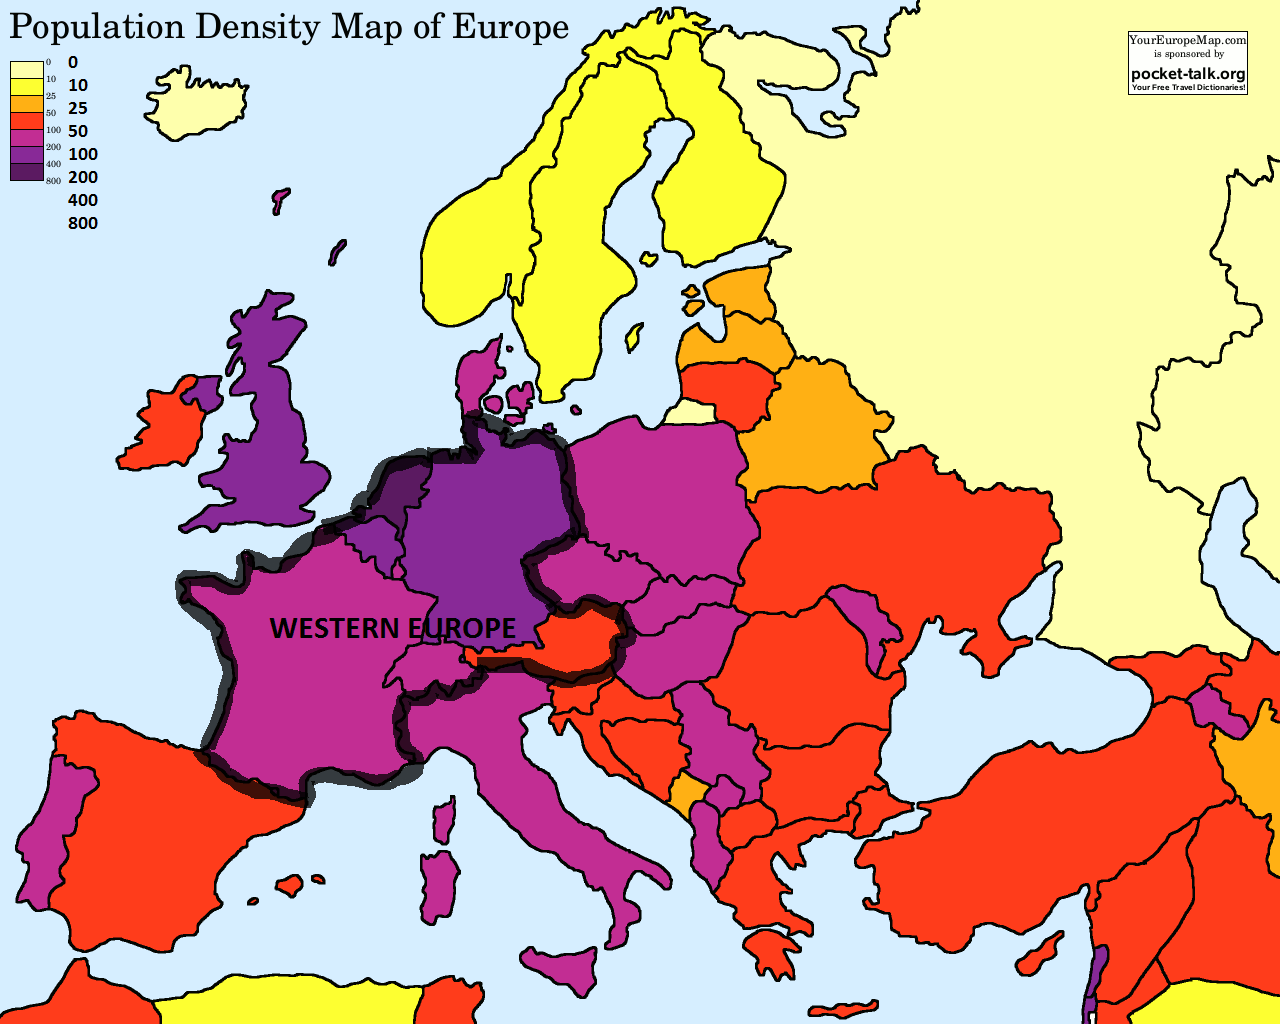
In the Western European section it seems that the countries that the countries are very compacted into big cities. For most of the countries there are big numbers except for 2 countries. They are also big countries for the exception of 3 countries. 76.4% are urban and 23.6 are rural in Western Europe.
